Association Between Limited English Language Proficiency and Disparities in Length of Stay and Discharge Disposition After Total Shoulder Arthroplasty: A Retrospective Cohort Stud
@Kyle_2023_Association_BetweenAbstract results
Each result the abstract reports — is it captured as evidence?
Forty-one patients were included in each cohort, exceeding the minimum number required per an a priori power analysis.
Mean hospital LOS was longer in the interpreter cohort than in the non-interpreter cohort (2.8 ± 2.4 vs 1.8 ± 1.0 days, respectively).
suggested · 18% In a matched retrospective cohort of total shoulder arthroplasty (TSA) patients, mean hospital length of stay (LOS) was longer in
Multivariate linear regression demonstrated interpreter use was the strongest predictor of LOS, with the effect estimate indicating an additional 0.88-day LOS per patient.
suggested · 28% In a matched retrospective cohort of total shoulder arthroplasty (TSA) patients, mean hospital length of stay (LOS) was longer in
A greater proportion of patients from the interpreter cohort were discharged to an acute/subacute rehabilitation facility than patients from the non-interpreter cohort (n = 8 [19.5%] vs n = 2 [4.9%], respectively).
suggested · 31% In the matched TSA cohort, a greater proportion of interpreter-requiring patients were discharged to an acute or subacute rehabili
Patients from the interpreter cohort were 454% more likely to be discharged to acute/subacute rehabilitation facilities.
suggested · 28% In the matched TSA cohort, a greater proportion of interpreter-requiring patients were discharged to an acute or subacute rehabili
Our retrospective analysis of patients undergoing TSA suggests that the need for interpreter services may be associated with increased LOS and discharge to a facility.
More rigorous study is needed to identify the factors that influence these outcomes and to avoid disparities in hospital stay and discharge.
Tables & figures
Map each object to the evidence it grounds (one object can ground several), add anything missed, or flag a gap.
Table 1 — Baseline characteristics of study population.
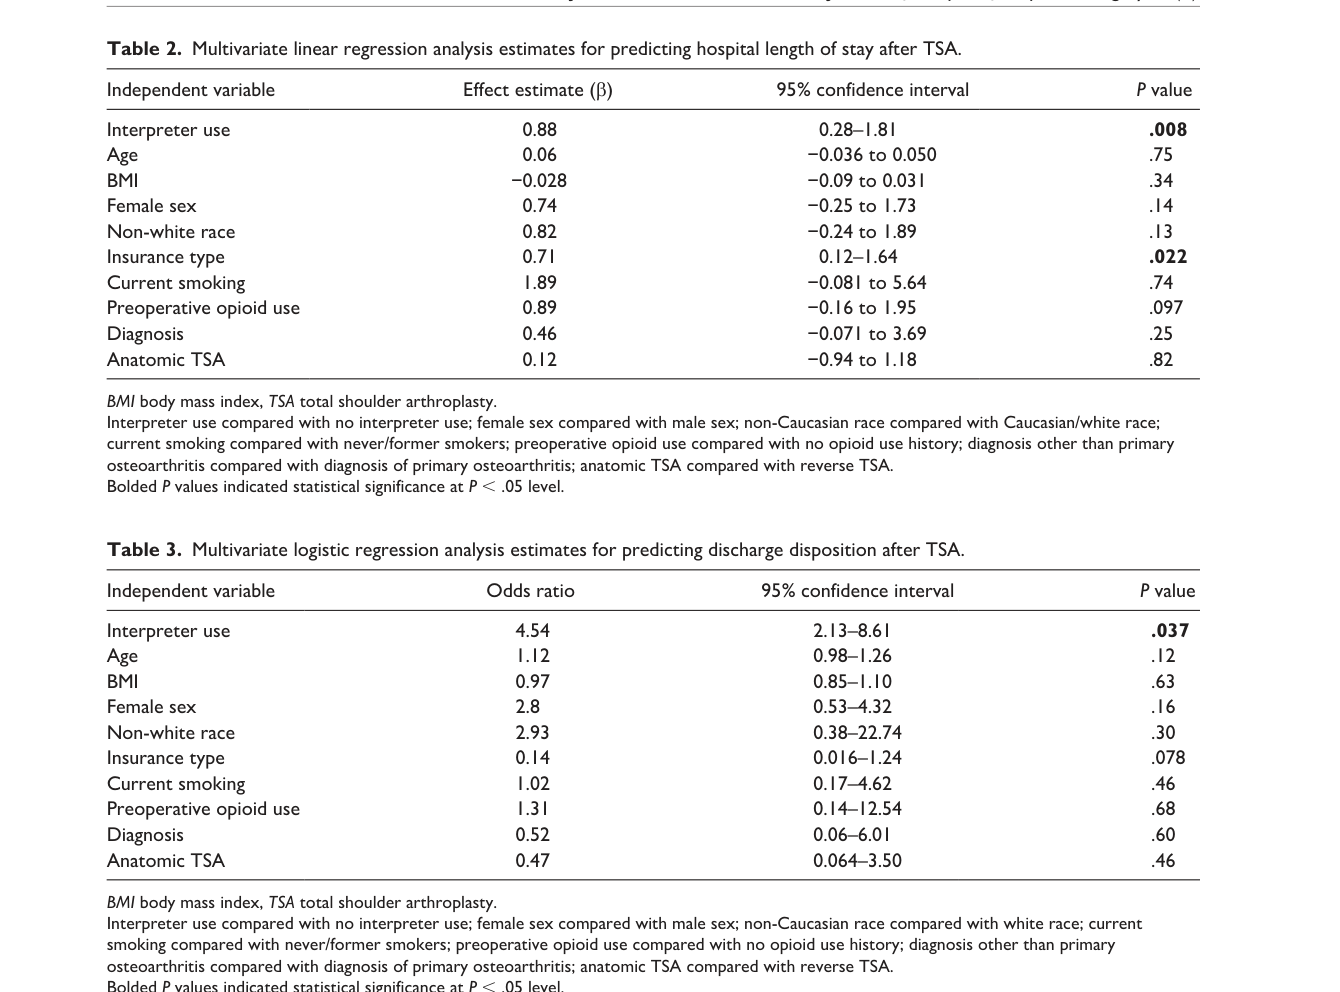
Table 2 — Multivariate linear regression analysis estimates for predicting hospital length of stay after TSA.
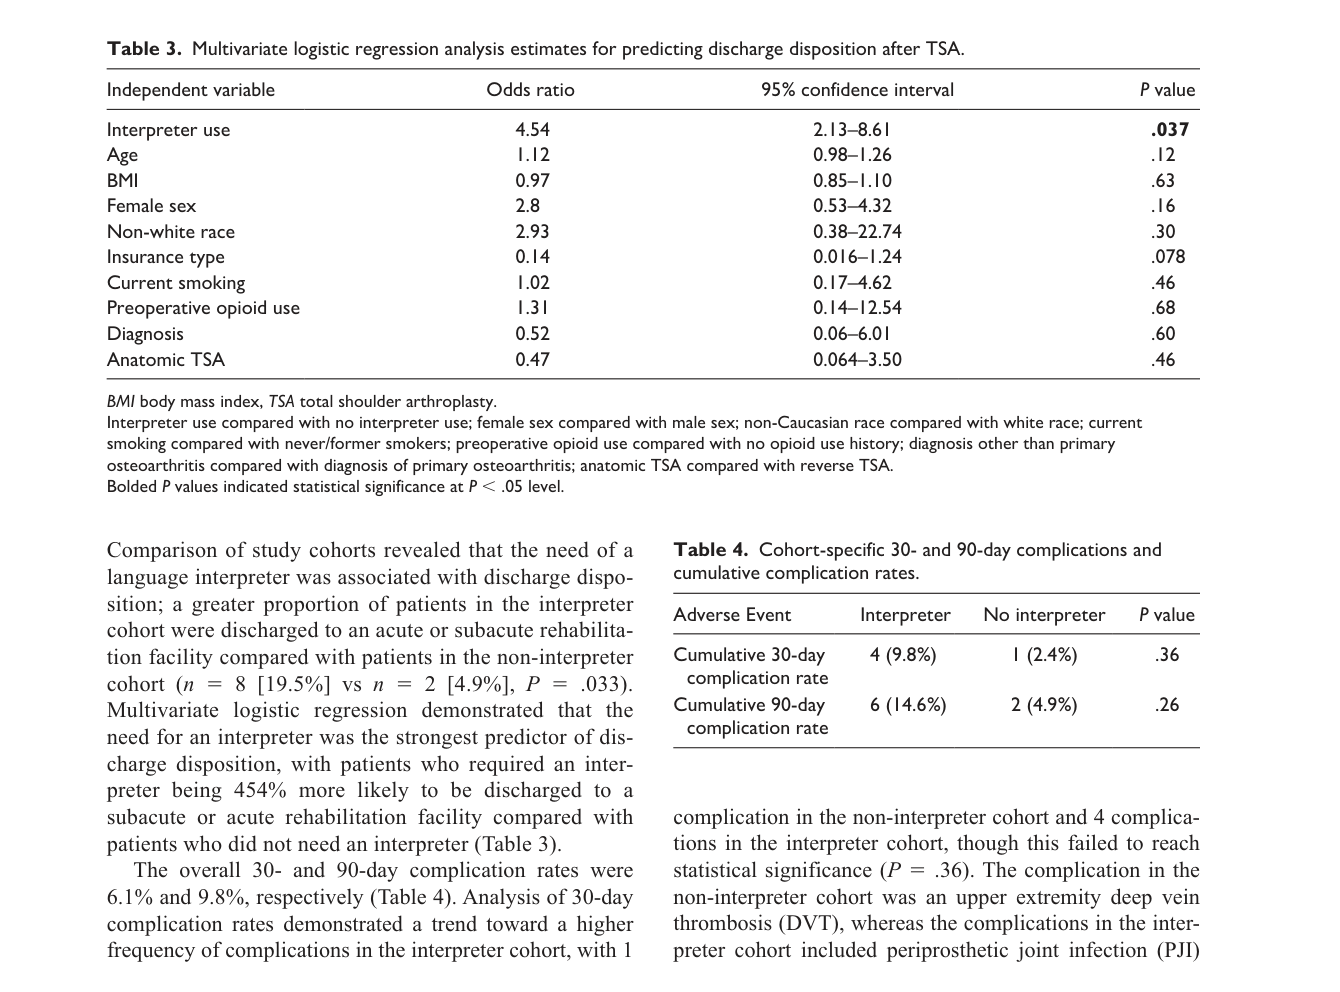
Table 3 — Multivariate logistic regression analysis estimates for predicting discharge disposition after TSA.
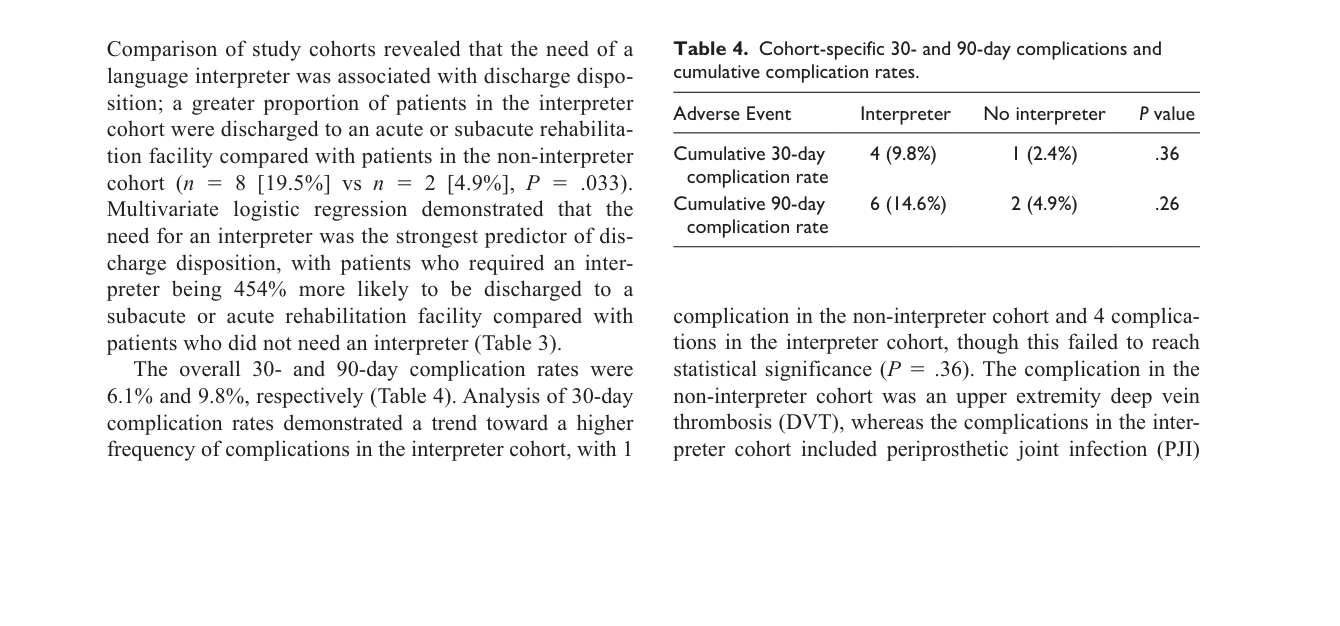
Table 4 — Cohort-specific 30- and 90-day complications and