Clinician Perspectives on the Management of Hearing Loss in Patients With Limited English Proficiency
@Aparna_2025_Clinician_PerspectivesAbstract results
Each result the abstract reports — is it captured as evidence?
Twenty-nine providers participated in interviews (16 otologists, 13 audiologists).
The most reported non-English language was Spanish, followed by Chinese languages.
Four thematic domains were derived: barriers to care, cochlear implant (CI) candidacy evaluation, counseling, and ideal resources.
Major barriers were patient desire (97%; n = 28), and lack of validated tests (72%; n = 21).
Methods of CI evaluation included improvising on validated speech perception testing (59%; n = 17) and use of non-speech evaluation (52%; n = 15).
suggested · 18% In the interviews (n = 29), providers reported two non-exclusive workarounds for cochlear-implant candidacy evaluation in LEP pati
One-quarter forgoes speech testing in non-Spanish-speaking patients (24%; n = 7).
Suggestions to improve management include in-person interpreters (62%; n = 18) and testing battery in all languages (31%; n = 9).
National survey results (n = 87 providers) demonstrated that respondents were significantly less confident in the methods of speech perception testing and in counseling on surgical hearing rehabilitation in LEP.
Clinicians encounter challenges in managing LEP patients with HL, including limitations in audiometric and CI candidacy assessment, communication barriers, information accessibility, and cultural competency.
Opportunities for improving care include developing language-specific test batteries, linguistically and culturally appropriate education materials, and cultural competency training.
Tables & figures
Map each object to the evidence it grounds (one object can ground several), add anything missed, or flag a gap.
Figure 1 — Top non-English languages seen by respondents (n = 29).
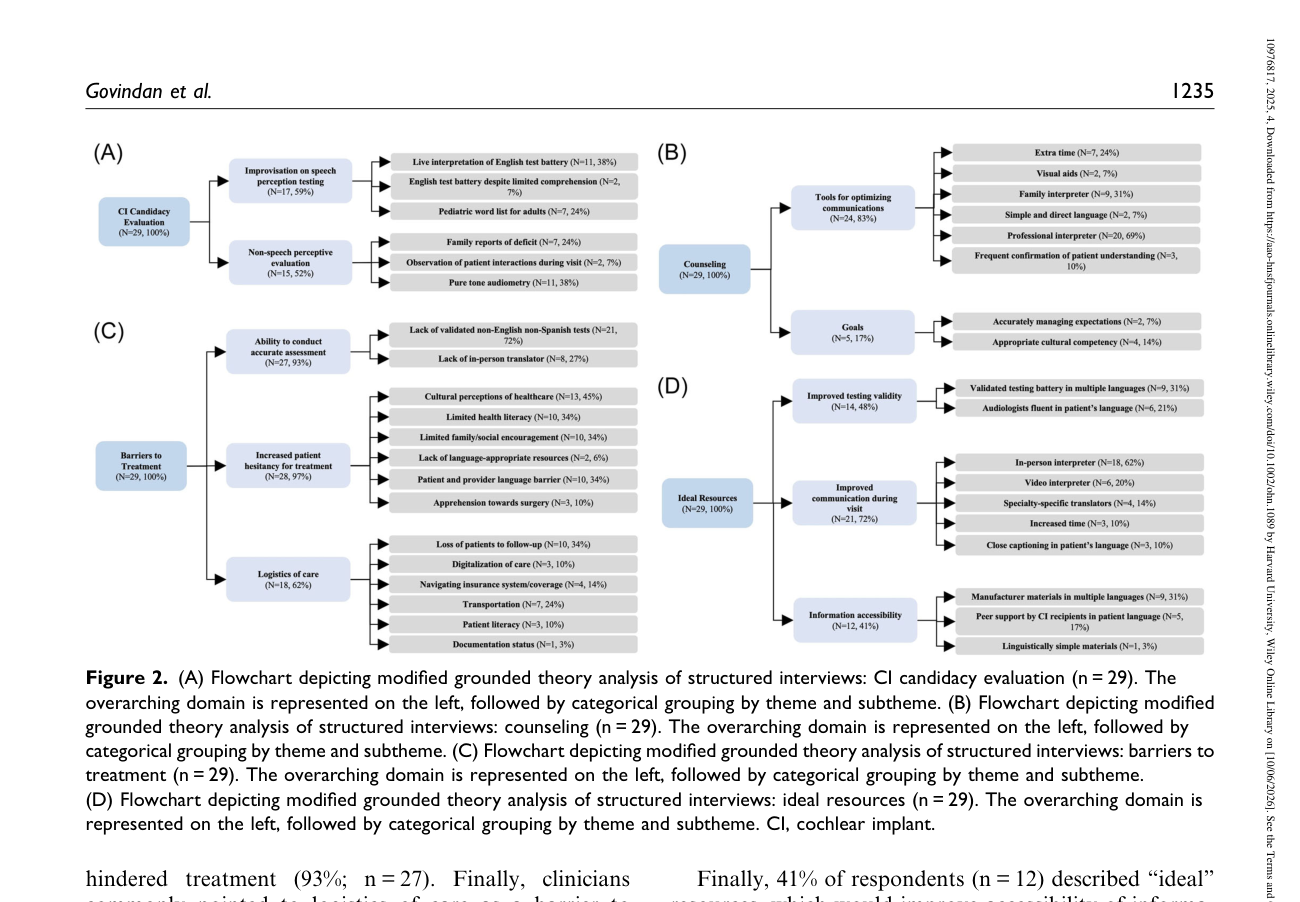
Figure 2 — (A) Flowchart depicting modified grounded theory analysis of structured interviews: CI candidacy evaluation (n = 29). The
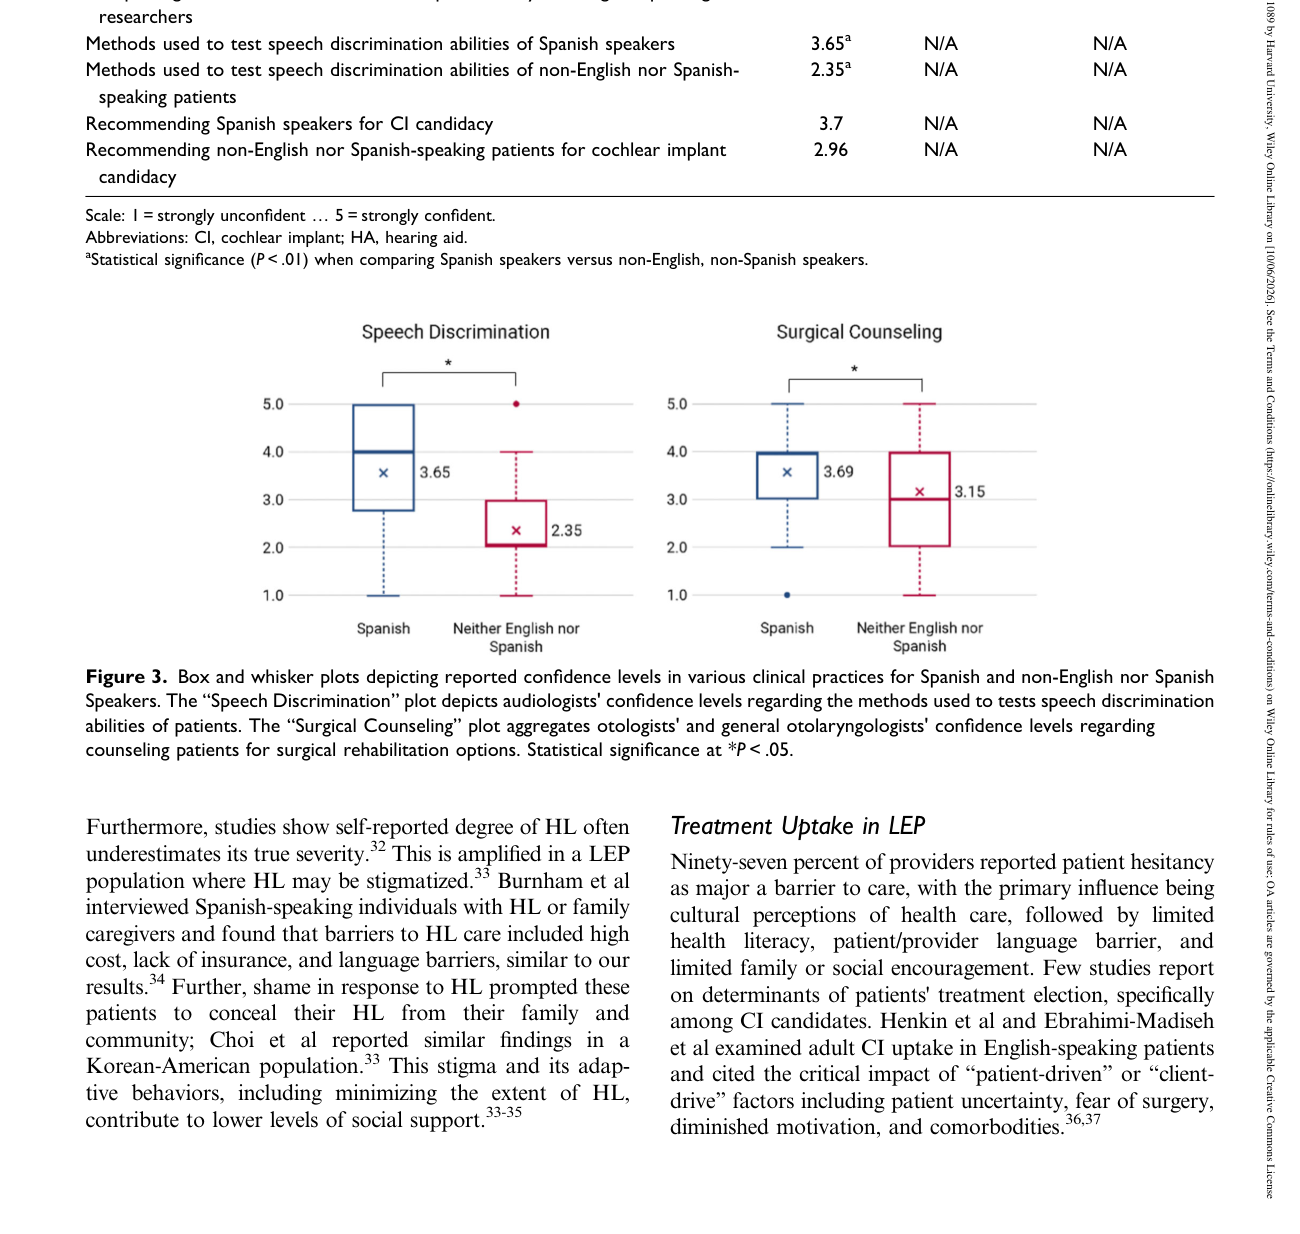
Figure 3 — Box and whisker plots depicting reported confidence levels in various clinical practices for Spanish and non-English nor Spanish
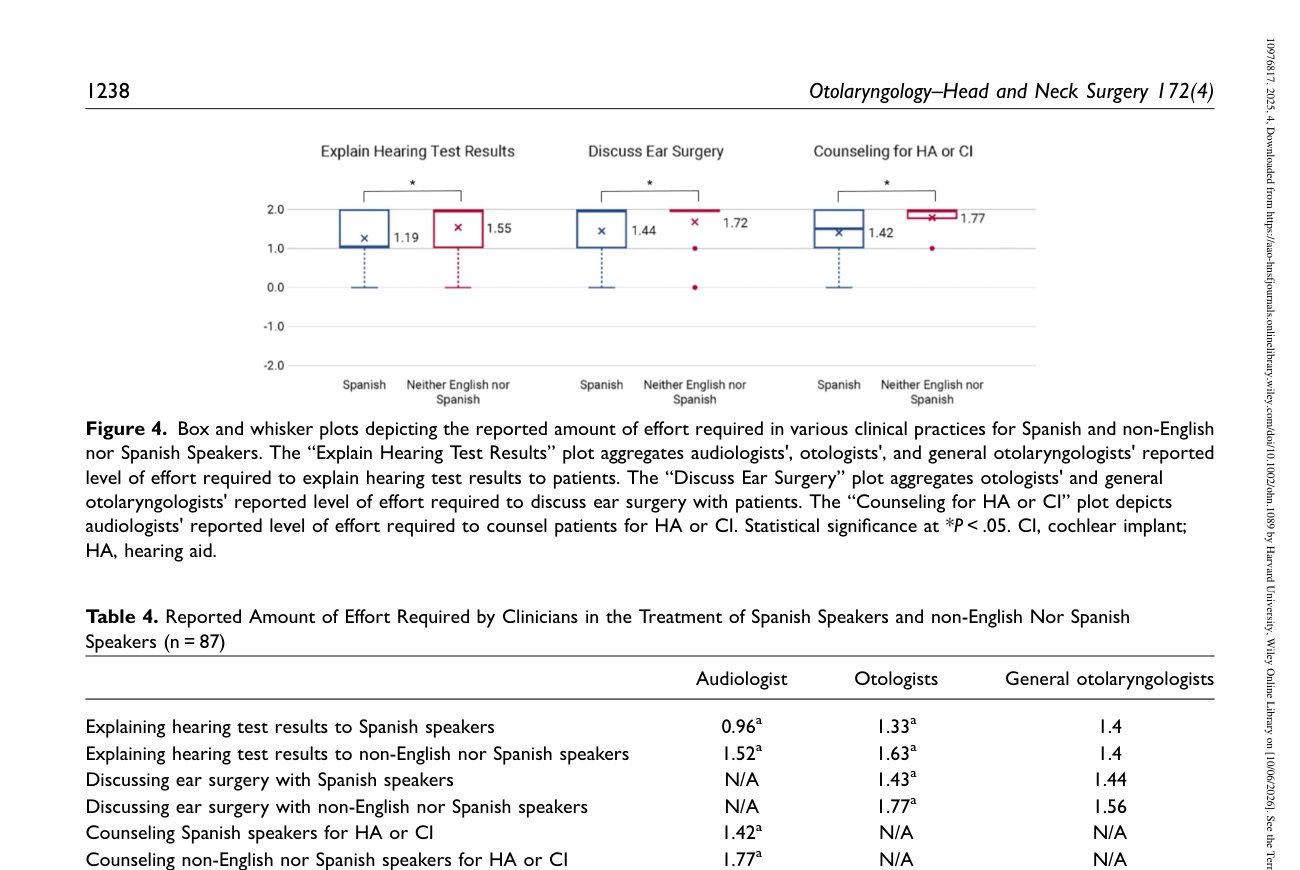
Figure 4 — Box and whisker plots depicting the reported amount of effort required in various clinical practices for Spanish and non-English
Table 1 — Number of Audiologists and Neurotologists Interviewed and Average Number of Years in Practice by Region (n = 29)
Table 2 — Demographics and Practice Characteristics of Survey
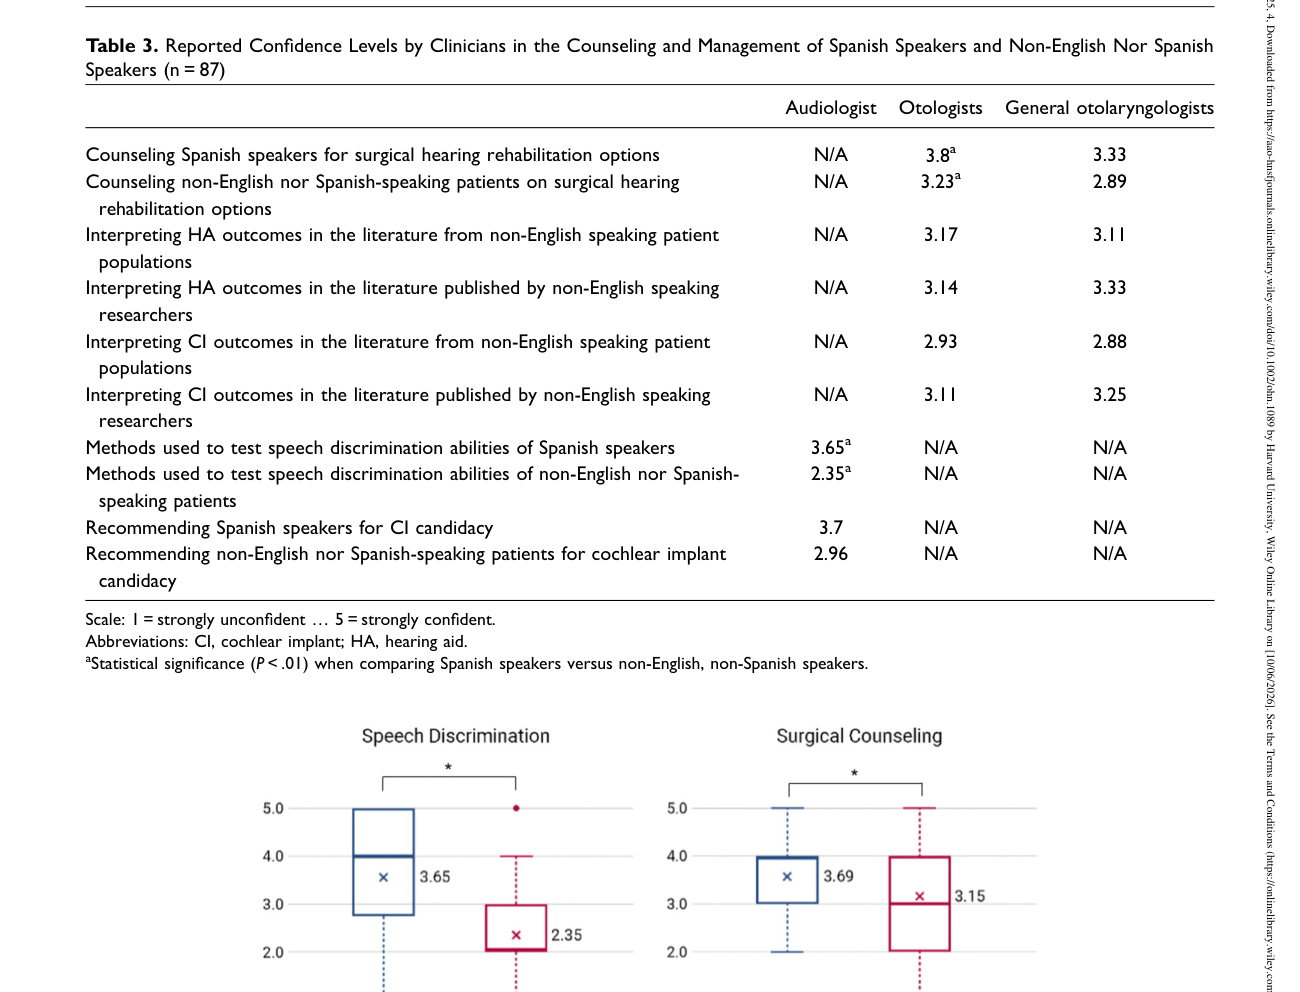
Table 3 — Reported Confidence Levels by Clinicians in the Counseling and Management of Spanish Speakers and Non-English Nor Spanish
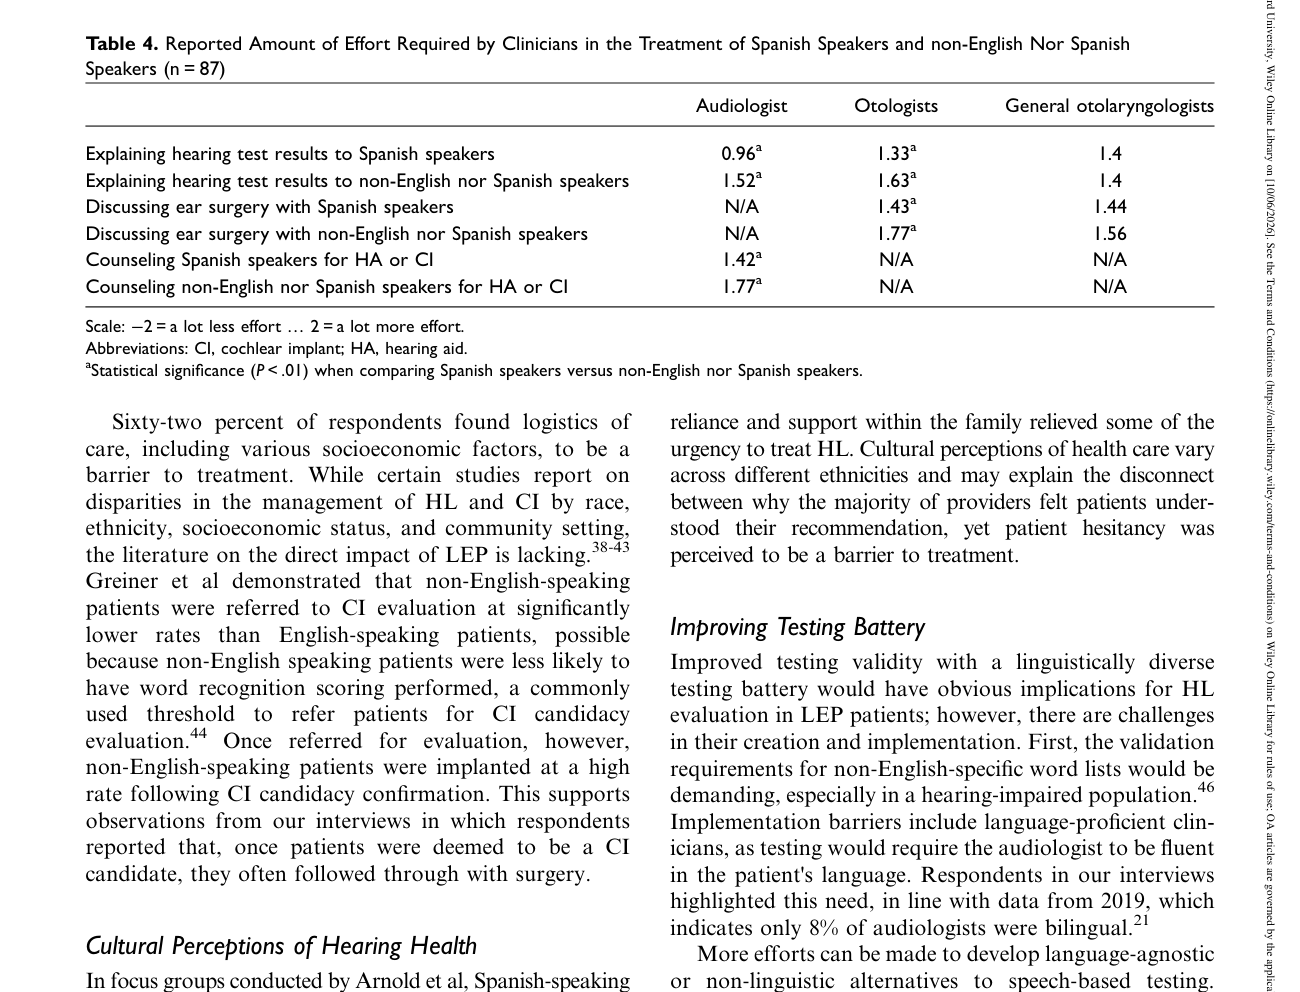
Table 4 — Reported Amount of Effort Required by Clinicians in the Treatment of Spanish Speakers and non-English Nor Spanish