Need for in-person interpreters and caregiver-translated materials was significantly associated with pediatric BMT centers
Source
Idossa (2019). Access to Linguistically Appropriate Information for Blood and Marrow Transplant Patients: Results from Transplant Center Staff Survey. Journal of Cancer Education.
Description #
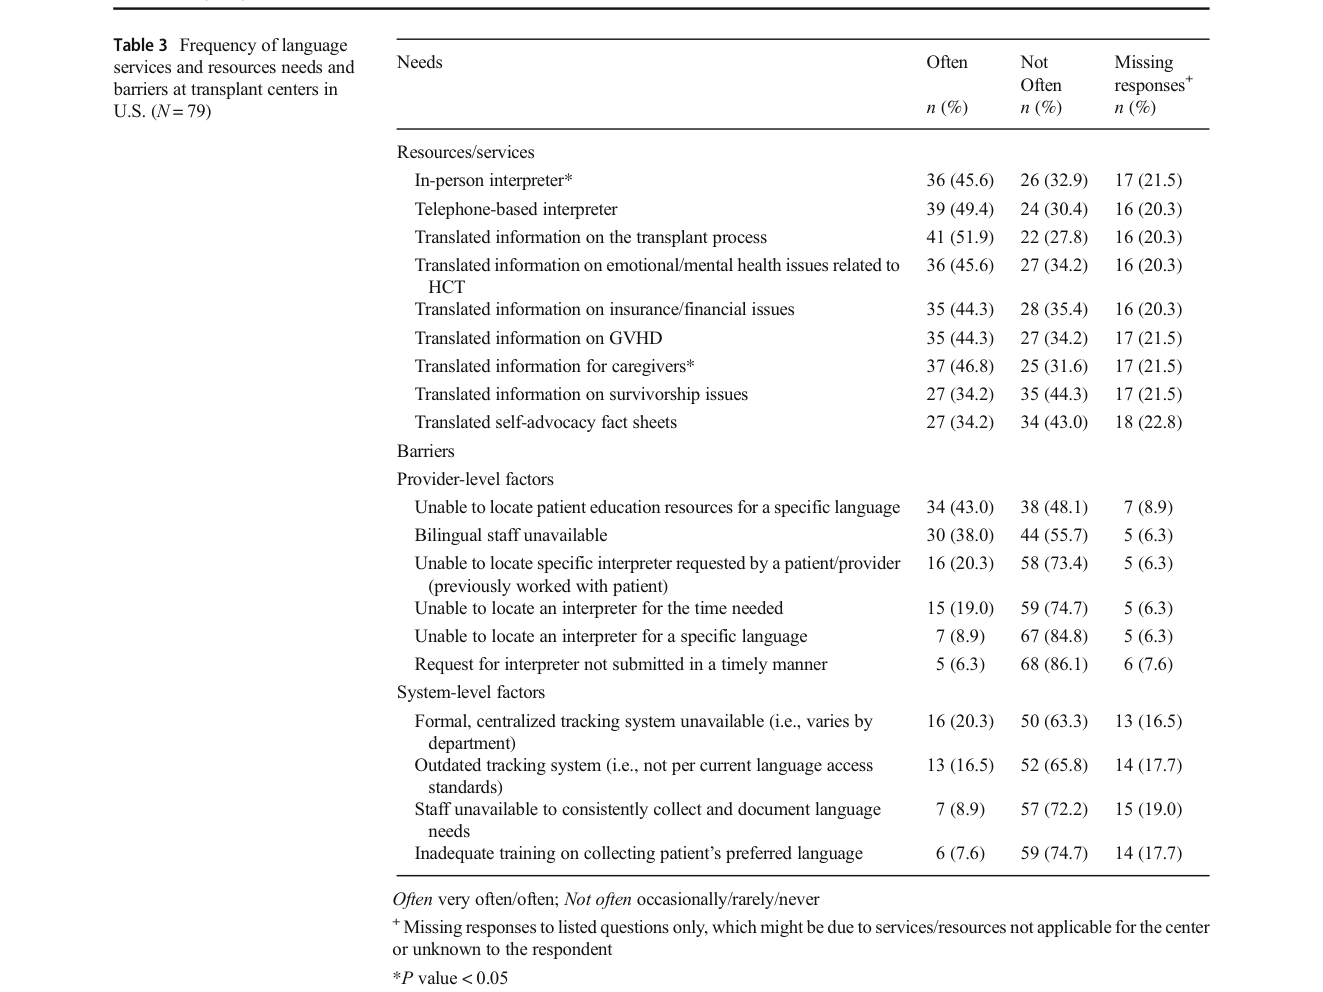
The need for in-person interpreters and for translated information for caregivers was significantly associated with transplant centers serving the pediatric patient population (P < 0.05) (Table 3). The need for in-house full-time and part-time interpreter staff was likewise significantly associated with the pediatric patient population only (P < 0.05). This indicates that pediatric-serving centers report heightened language-service needs relative to adult-only centers.
"The need for in-person interpreters and translated information for caregivers was significantly associated with TCs serving the pediatric patient population (P < 0.05). In-house full-time (39%) and part-time (23%) interpreter staff were available resources. The need for in-house full-time and part-time interpreter staff was significantly associated with the pediatric patient population only (P < 0.05)." (Idossa, 2019, p. 1034)
Methods Context #
What? #ⓘ
The observable: whether resource needs (in-person interpreters, caregiver-translated materials, in-house interpreter staff) differed by whether the center served pediatric versus adult patient populations.
"Likert scales were also used to measure frequency of language service requests by patients (such as telephone and in-person interpreting, and translated materials in a variety of formats)." (Idossa, 2019, p. 1033)
How? #ⓘ
Cross-sectional web-based survey; needs were collapsed into "often"/"not often" and compared across patient-population groups with Chi-square or Fisher's exact tests.
"In order to meet Chi-square test assumptions, Likert scales were collapsed into two categories, Boften^ and Bnot often,^ for comparison of language service requests and provider-level/system-level barriers by geographic region and patient population." (Idossa, 2019, p. 1033)
Who? #ⓘ
Transplant-center-staff respondents grouped by served patient population; 23.2% served pediatric only, 26.8% adult only, and 36.6% both (Table 1).
"Patient population Pediatric ... 19 (23.2) Adult ... 22 (26.8) Both ... 30 (36.6)" (Idossa, 2019, p. 1033, Table 1)
Other Notes #
Two starred items in Table 3 (in-person interpreter and translated information for caregivers, marked "*P value < 0.05") correspond to this pediatric association. This is a Chi-square/Fisher's association on collapsed categories, not an effect estimate with a confidence interval.
Caveats #
- Cross-sectional TC-staff survey (59 percent response) underrepresents small-volume centers and non-social-worker roles with high item missingness The estimates come from a cross-sectional web-based survey with a 59% response rate in which not every transplant center provided input; patient educators/advocates and transplant coordinators were poorly represented (respondents were overwhelmingly social workers), and small-volume centers (fewer than 100 BMTs/year) were underrepresented relative to medium and large centers. In addition, many items carried a relatively high percentage of missing responses (e.g., 16.5–22.8% missing on Table 3 items), which the authors attribute to respondents not knowing or the item not applying. Together these features limit the representativeness and precision of the reported frequencies of needs and barriers.