Translated transplant-process information and telephone interpreting were the most often-needed language resources at BMT centers
Source
Idossa (2019). Access to Linguistically Appropriate Information for Blood and Marrow Transplant Patients: Results from Transplant Center Staff Survey. Journal of Cancer Education.
Description #
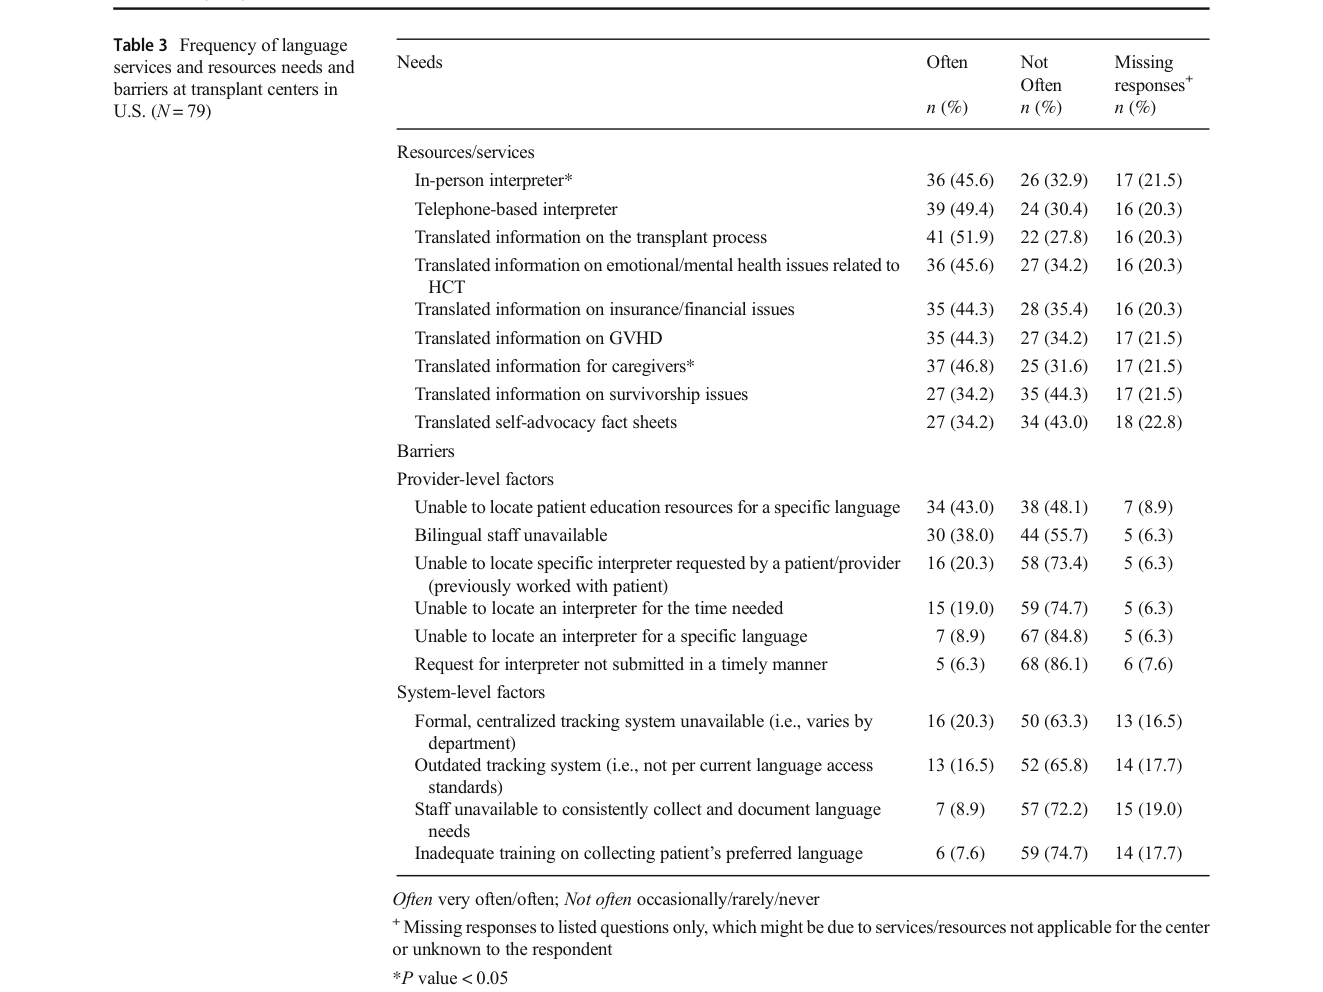
The language resources most often needed at BMT centers were translated information on the transplant process (51.9%), telephone-based interpreter services (49.4%), translated information for caregivers (46.8%), and in-person interpreters and translated information on emotional/mental health issues related to HCT (45.6% each) (Table 3). Lower on the list were translated information on survivorship issues (34.2%) and translated self-advocacy fact sheets (34.2%).
"The most often-needed resources included: translated information on the transplant process (51.9%), telephone-based interpreter (49.4%), translated information for caregivers (46.8%), in-person interpreters and translated information on emotional/mental health issues related to HCT (45.6%) (Table 3)." (Idossa, 2019, p. 1034)
Methods Context #
What? #ⓘ
The observable: how often each specific language service or translated resource was needed at the transplant center.
"Likert scales were also used to measure frequency of language service requests by patients (such as telephone and in-person interpreting, and translated materials in a variety of formats)." (Idossa, 2019, p. 1033)
How? #ⓘ
Cross-sectional web-based survey; resource-need frequency was captured on five-point Likert scales and collapsed into "often" (very often/often) versus "not often."
"Often very often/often; Not often occasionally/rarely/never" (Idossa, 2019, p. 1035, Table 3)
Who? #ⓘ
The transplant-center-staff respondents to the resources/barriers items; Table 3 is based on N = 79 (missing responses noted per item).
"Frequency of language services and resources needs and barriers at transplant centers in U.S. (N = 79)" (Idossa, 2019, p. 1035, Table 3)
Other Notes #
In-house interpreter staff were a commonly available resource: full-time (39%) and part-time (23%) interpreter staff. "In-house full-time (39%) and part-time (23%) interpreter staff were available resources." (Idossa, 2019, p. 1034). The Discussion adds that brochures and booklets on the BMT process were the preferred format, and that telephone-based services were the most commonly used interpreter resource though in-person may be more effective for complex encounters (Idossa, 2019, p. 1036).
Caveats #
- Needs are aggregate staff-reported perceptions with no patient-level denominator of LEP patients served or excluded The reported language needs and demand distributions are aggregate staff perceptions, not patient-level measurements. The survey did not determine the exact number of LEP patients each participating center serves, and the authors had no data on LEP patients who never access BMT. The reported prevalences of most-requested and most-difficult languages therefore reflect staff-perceived frequency rather than a denominator-based count of LEP patients, and may not capture the needs of patients who are screened out or never reach a transplant center.
- Cross-sectional TC-staff survey (59 percent response) underrepresents small-volume centers and non-social-worker roles with high item missingness The estimates come from a cross-sectional web-based survey with a 59% response rate in which not every transplant center provided input; patient educators/advocates and transplant coordinators were poorly represented (respondents were overwhelmingly social workers), and small-volume centers (fewer than 100 BMTs/year) were underrepresented relative to medium and large centers. In addition, many items carried a relatively high percentage of missing responses (e.g., 16.5–22.8% missing on Table 3 items), which the authors attribute to respondents not knowing or the item not applying. Together these features limit the representativeness and precision of the reported frequencies of needs and barriers.