About half of LEP surgical patients received fewer than one interpreting event per day
Source
Claire de Crescenzo (2022). Increasing Frequency of Interpreting Services is Associated With Shorter Peri-operative Length of Stay. Journal of Surgical Research.
Description #
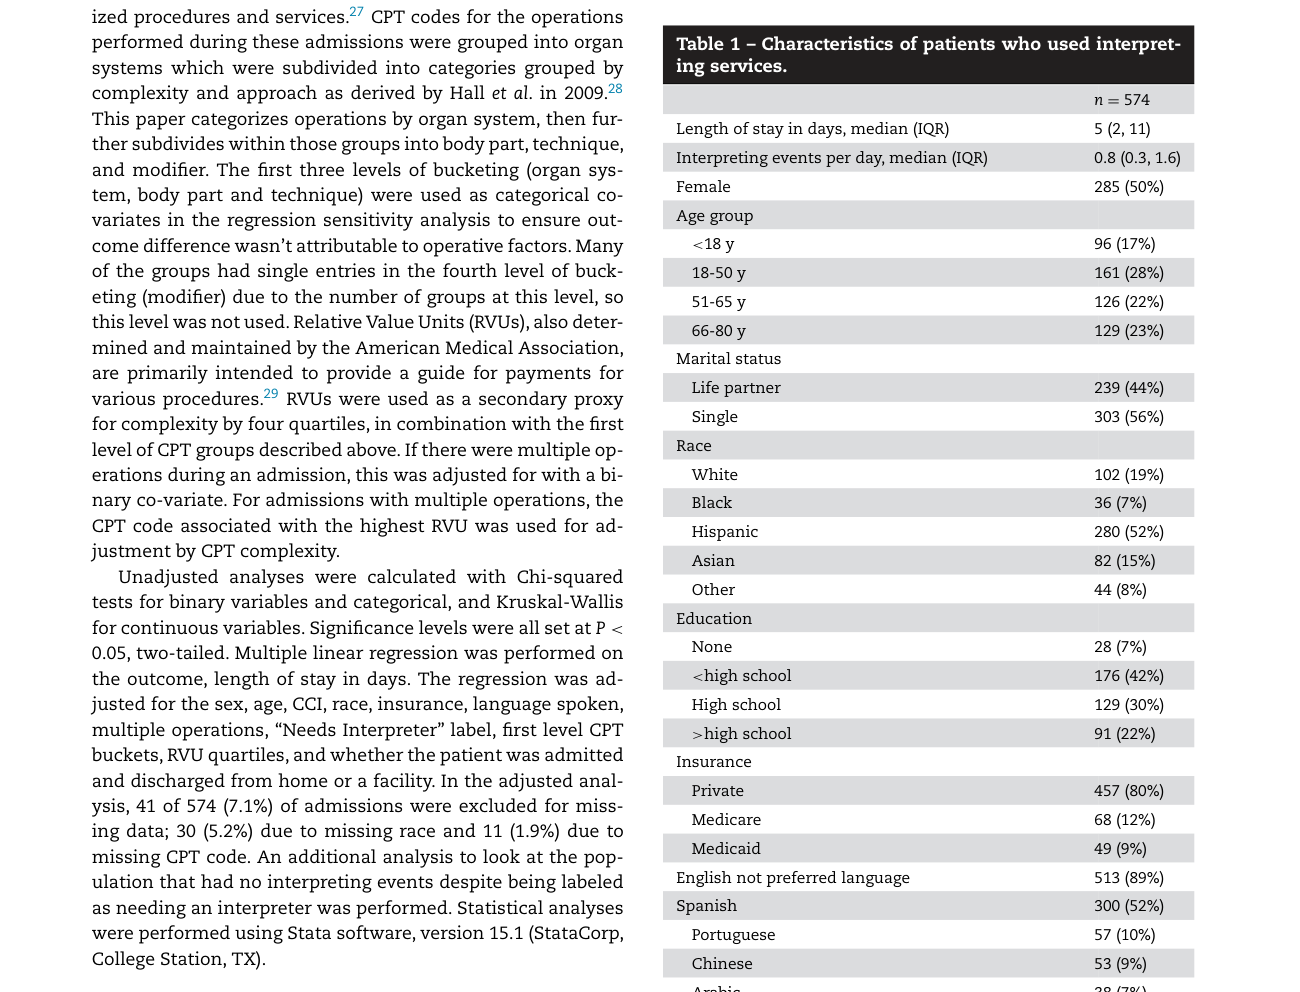
Among LEP surgical patients who used interpreting services during a peri-operative admission, provision was infrequent: the median was 0.8 interpreting events per day (IQR 0.3, 1.6) (Table 1), and the authors concluded that approximately half of study patients received fewer than one interpreting event per day — below the at-least-daily contact the authors expected for LEP inpatients. This documents under-provision of language-access services to surgical LEP patients even among those who received any interpreting.
"Interpreting events per day, median (IQR) 0.8 (0.3, 1.6)" (de Crescenzo, 2022, p. 180, Table 1)
"the authors are concerned that approximately half the patients in the study received less than one daily interpreting service." (de Crescenzo, 2022, p. 185)
Methods Context #
What? #ⓘ
The observable: frequency of interpreting events per day (InEpD) received per admission, summarized as a distribution and as the proportion below one event per day.
"The primary outcome was length of stay in days and the independent variable of interest was frequency of interpreting, measured in interpreting events per day." (de Crescenzo, 2022, p. 179)
How? #ⓘ
Descriptive cross-sectional tabulation of interpreting-event counts (from the medical interpreting office records) divided by admission length, across all included admissions.
"the number of interpreting events per day (InEpD) from the medical interpreting office records at a tertiary care academic institution in the Boston metro area" (de Crescenzo, 2022, p. 180)
Who? #ⓘ
545 patients across 574 peri-operative admissions in 2018 who used interpreting services at least once at a Boston academic medical center.
"A total of 545 patients used interpreting services at least once during 574 peri-operative admissions." (de Crescenzo, 2022, p. 180)
Other Notes #
Corroborated by the quartile structure in Table 2: quartiles 1 and 2 (both below one event/day, 297 of 574 admissions ≈ 52%) fall under the daily threshold. A separate secondary analysis of 199 patients labeled "Need Interpreter" who received no interpreting at all (median LOS 3 d) was excluded from the main analysis as a heterogeneous group (some mislabeled English-proficient patients).
Caveats #
- Language-concordant staff and non-spoken communication gaps were not captured, misclassifying true communication frequency (Claire 2022) The exposure (interpreting events per day from the interpreting office) undercounts actual language-concordant communication: encounters where a language-concordant provider communicated directly with an LEP patient without engaging an interpreter are not recorded in the data, so some patients coded as low-frequency may in fact have had adequate communication. The measure also captures only spoken-language interpreting and does not account for other patient-provider communication gaps such as reading and health literacy or the navigability of written discharge and follow-up materials. Both forms of misclassification blur the mapping between the recorded interpreting frequency and the true adequacy of communication that the LOS association is meant to reflect.