Highest interpreting-frequency quartile had 4.6-day shorter adjusted peri-operative LOS vs lowest
Source
Claire de Crescenzo (2022). Increasing Frequency of Interpreting Services is Associated With Shorter Peri-operative Length of Stay. Journal of Surgical Research.
Description #
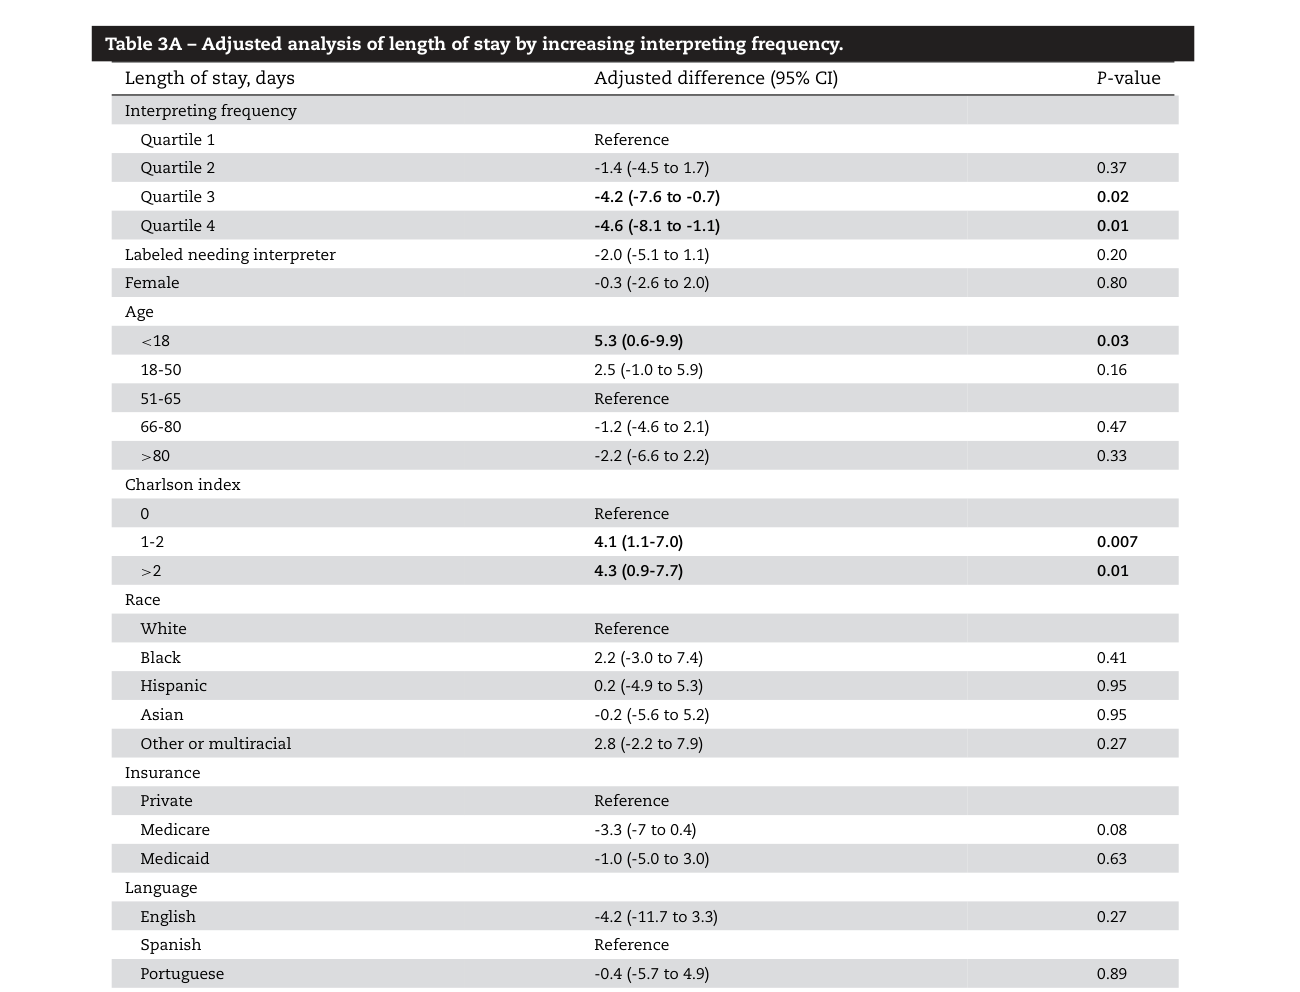
In the adjusted multiple linear regression, patients in the highest interpreting-frequency quartile (quartile 4, ≥ 1.50 interpreting events/day) had a peri-operative length of stay 4.6 days shorter than the lowest-frequency reference quartile 1, a statistically significant difference (95% CI -8.1 to -1.1, P = 0.01) (Table 3A). This is the largest adjusted effect among the interpreting-frequency quartiles and anchors the exposure-response relationship.
"was statistically significantly shorter by 4.6 d in quartile 4 (CI -8.1 to -1.1, P = 0.01)" (de Crescenzo, 2022, p. 183)
"Quartile 4 -4.6 (-8.1 to -1.1) 0.01" (de Crescenzo, 2022, p. 182, Table 3A)
Methods Context #
What? #ⓘ
The observable: peri-operative length of stay in days, modeled as the outcome of a multiple linear regression with interpreting-frequency quartile as the exposure of interest.
"The primary outcome was length of stay in days and the independent variable of interest was frequency of interpreting, measured in interpreting events per day." (de Crescenzo, 2022, p. 179)
How? #ⓘ
Multiple linear regression on LOS in days, adjusted for sex, age, CCI, race, insurance, language, "Needs Interpreter" label, multiple operations, first-level CPT buckets, RVU quartiles, and admission/discharge location (home vs facility); quartile 1 was the reference.
"Multiple linear regression was performed on the outcome, length of stay in days. The regression was adjusted for the sex, age, CCI, race, insurance, language spoken, multiple operations, "Needs Interpreter" label, first level CPT buckets, RVU quartiles, and whether the patient was admitted and discharged from home or a facility." (de Crescenzo, 2022, p. 180)
Who? #ⓘ
Peri-operative admissions in 2018 at a Boston academic medical center; 41 of 574 admissions (7.1%) were excluded from the adjusted analysis for missing data, leaving 533.
"In the adjusted analysis, 41 of 574 (7.1%) of admissions were excluded for missing data; 30 (5.2%) due to missing race and 11 (1.9%) due to missing CPT code." (de Crescenzo, 2022, p. 180)
Other Notes #
Quartile 4 = "Three events in 2 d, or more frequent (1.50 or more interpreting events per day)."
Caveats #
- Cross-sectional design cannot establish causality and interpreting-events-per-day has LOS in its denominator (Claire 2022) The study is cross-sectional and, as the authors state, was not designed to demonstrate causality; the association between higher interpreting frequency and shorter LOS could reflect reverse or confounded pathways rather than an effect of interpreting. A specific structural concern reinforces this: the exposure is interpreting events per day, i.e. total interpreting events divided by length of stay, so length of stay is in the denominator of the exposure. Mechanically, a short admission (few days) tends to yield a higher events-per-day value for the same or fewer total encounters, which can manufacture an inverse exposure-outcome association independent of any causal benefit. The authors frame the finding as motivating an interventional study rather than as evidence of a causal effect.
- Small single-institution study of heterogeneous operations with incomplete operative-complexity adjustment (Claire 2022) This is a small, single-institution study whose patients underwent a heterogeneous array of operations of varying complexity, and operative complexity is a strong determinant of length of stay. The complexity-correction factors used (CPT groupings and RVU quartiles) do not exhaustively capture those differences, leaving residual confounding by case mix as a plausible partial explanation for the shorter LOS at higher interpreting frequencies. The single-center, single-year setting also limits generalizability, since medical interpreting services are not standardized and vary substantially across institutions and geographic locations. The authors ran a five-model sensitivity analysis as a partial mitigation but acknowledge it does not fully correct for complexity.
- Language-concordant staff and non-spoken communication gaps were not captured, misclassifying true communication frequency (Claire 2022) The exposure (interpreting events per day from the interpreting office) undercounts actual language-concordant communication: encounters where a language-concordant provider communicated directly with an LEP patient without engaging an interpreter are not recorded in the data, so some patients coded as low-frequency may in fact have had adequate communication. The measure also captures only spoken-language interpreting and does not account for other patient-provider communication gaps such as reading and health literacy or the navigability of written discharge and follow-up materials. Both forms of misclassification blur the mapping between the recorded interpreting frequency and the true adequacy of communication that the LOS association is meant to reflect.