LEP patients had worse preoperative visual acuity (logMAR 0.566 vs 0.366) before cataract surgery
Source
Zafar Gill (2023). Comparison of cataract surgery outcomes in English proficient and limited English proficiency patients. journal of catact and refractive surgery.
Description #
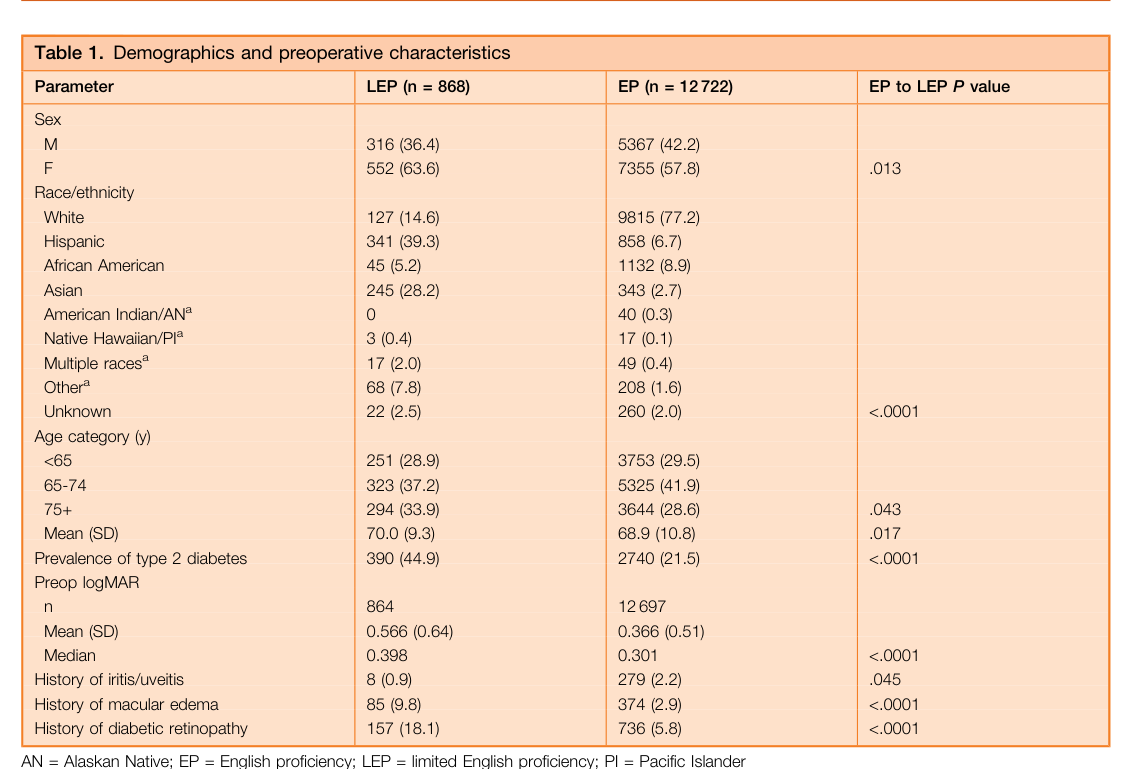
LEP patients presented with worse preoperative corrected distance visual acuity (CDVA) than EP patients (logMAR 0.566 [SD = 0.64] vs 0.366 [SD = 0.51], P < .0001; median 0.398 vs 0.301) (Table 1). Higher logMAR indicates worse acuity, so LEP patients had more visual impairment at presentation.
"Preoperative visual acuity was worse in LEP patients (logMAR 0.566 [SD = 0.64] vs 0.366 [SD = 0.51], P < .0001)" (Zafar, 2023, p. 595)
"Preop logMAR ... Mean (SD) 0.566 (0.64) 0.366 (0.51) ... <.0001" (Zafar, 2023, p. 597, Table 1)
Methods Context #
What? #ⓘ
The observable: preoperative corrected distance visual acuity (CDVA), recorded in logMAR.
"Demographic and preoperative characteristics analyzed included sex, patients' self-reported race, ethnicity, age, preoperative corrected distance visual acuity (CDVA), as well as a history of type 2 diabetes, uveitis, macular edema, and diabetic retinopathy." (Zafar, 2023, p. 596)
How? #ⓘ
Retrospective analysis of a cataract-surgery outcomes database; preoperative CDVA compared by LEP status as a continuous variable.
"We performed a retrospective analysis using the Cataract Surgery Outcomes Database developed by the Department of Ophthalmology at the University of Colorado School of Medicine." (Zafar, 2023, p. 596)
Who? #ⓘ
Preoperative logMAR was available for 864 LEP eyes and 12,697 EP eyes of the 13,590-eye cohort at a single academic eye center (2014–2020).
"A total of 13 590 eyes were included in the analytic database. Of these, 868 (6.4%) were identified from LEP patients." (Zafar, 2023, p. 596)
Caveats #
- Single tertiary-referral academic center limits generalizability of LEP cataract findings (Zafar) The study drew from a single academic tertiary-referral eye center whose LEP population may differ from LEP patients elsewhere. Its LEP rate (6.4%) was below the metro Denver average, which the authors attribute to access barriers under-representing LEP patients and to the center serving patients from outside the metro area. The authors explicitly caution that this specific LEP group may not generalize to other practice settings.