Female LEP patients were more likely than males to receive an interpreter (65.1% vs 41.7%)
Source
Morris (2021). Factors associated with utilisation of health care interpreting services and the impact on length of stay and cost: A retrospective cohort analysis of audit dat. Health Promotion Journal of Australia.
Description #
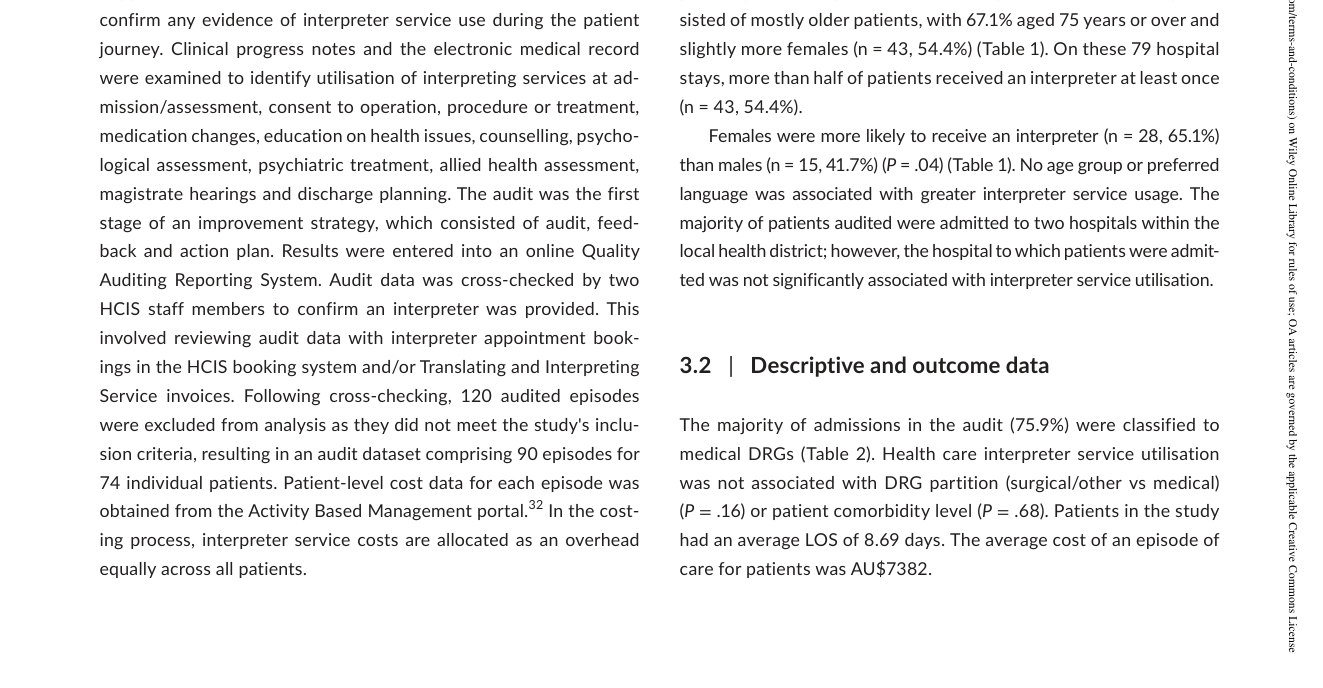
Among admitted LEP patients who required an interpreter, sex was the only socio-demographic or clinical characteristic associated with receiving one: females were more likely to receive an interpreter than males (65.1%, n = 28, vs 41.7%, n = 15; P = .04) (Table 1). Age group, preferred language, hospital, DRG partition and comorbidity level were not significantly associated with interpreter receipt.
"Females were more likely to receive an interpreter (n = 28, 65.1%) than males (n = 15, 41.7%) (P = .04) (Table 1). No age group or preferred language was associated with greater interpreter service usage." (Morris, 2021, p. 427)
"The only demographic or clinical characteristic associated with interpreter service utilisation in this study was sex, with females more likely to receive an interpreter when required than males. Blay et al also found female patients were more likely to receive an interpreter." (Morris, 2021, p. 430)
Methods Context #
What? #ⓘ
The observable: whether a patient received an interpreter, cross-tabulated against socio-demographic and clinical characteristics (sex, age, preferred language, hospital, DRG partition, comorbidity).
"This study aimed to ... (b) describing the characteristics of patients who were likely to receive an interpreter." (Morris, 2021, p. 426)
How? #ⓘ
Associations between interpreter receipt and categorical characteristics tested with Chi-square tests (or Fisher's exact test where expected cell frequencies were below five).
"Associations between categorical variables were analysed using Chi-square tests when observed frequencies in each cell was five or greater, otherwise a Fisher's exact test was used." (Morris, 2021, p. 427)
Who? #ⓘ
79 hospital stays (43 received an interpreter, 36 did not) by adult inpatients with a preferred language other than English needing an interpreter, audited across eight hospitals in one regional NSW (Australia) local health district, July 2016–March 2018; 36 male and 43 female stays.
"On these 79 hospital stays, more than half of patients received an interpreter at least once (n = 43, 54.4%)." (Morris, 2021, p. 427)
Other Notes #
The authors note other unmeasured predictors of utilisation (e.g. ward culture, time of day) were outside the study's scope, and that the female-sex association is consistent with prior Australian work (Blay et al).
Caveats #
- Exclusion of some wards and all obstetric patients limits generalisability (Morris 2021) The sample excluded some hospital wards and all obstetric patients (audited post-admission and therefore outside the inclusion criteria), as well as non-admitted (outpatient/ED ambulatory) patients. The authors note this limits the generalisability of the findings, so the utilisation rate and characteristics observed may not represent the full LEP inpatient population of the district.