About half (54.4%) of admitted LEP patients requiring an interpreter received one
Source
Morris (2021). Factors associated with utilisation of health care interpreting services and the impact on length of stay and cost: A retrospective cohort analysis of audit dat. Health Promotion Journal of Australia.
Description #
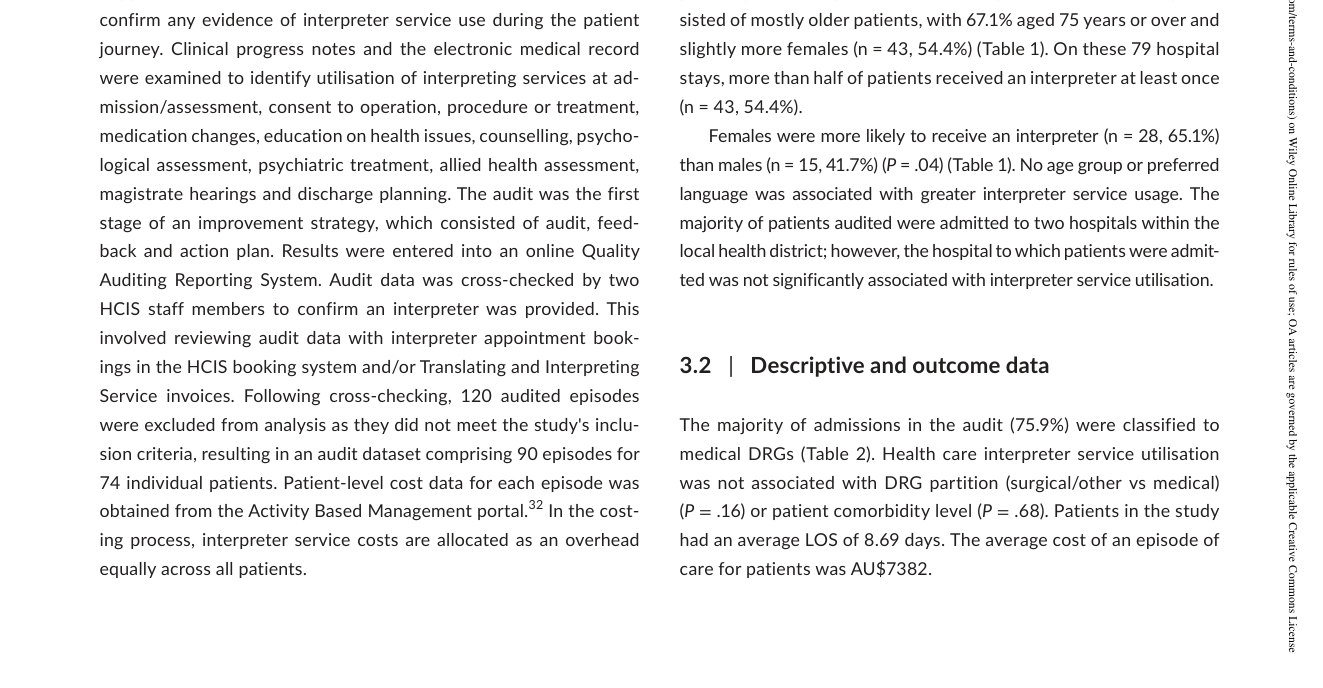
Across 79 hospital stays by admitted patients who required an interpreter, more than half received one at least once during admission — 54.4% (n = 43) (Table 1). The authors note this utilisation rate exceeds rates reported by other recent Australian studies (e.g. 37.2% and 17.1%), and was observed in a district with a long-running clinical-audit improvement program.
"On these 79 hospital stays, more than half of patients received an interpreter at least once (n = 43, 54.4%)." (Morris, 2021, p. 427)
"This study found just over half (54.4%) of admitted patients who required a health care interpreter received one, which exceeds results reported by other recent Australian studies. For example, one retrospective audit at a tertiary referral adult hospital found interpreter services were provided to 37.2% of admissions identified as patients with limited English proficiency, while another found 17.1% of patients requiring an interpreter were provided with the service." (Morris, 2021, p. 429)
Methods Context #
What? #ⓘ
The observable: whether an admitted patient who required an interpreter received one at least once during the hospital stay, expressed as a utilisation proportion.
"This study aimed to ... (a) estimating the proportion of admitted patients who received an interpreter when required." (Morris, 2021, p. 426)
How? #ⓘ
Retrospective clinical audit: Registered Nurses, Admissions Clerks and Clinical Support Officers reviewed clinical progress notes and the electronic medical record to confirm interpreter use across the patient journey; audit data were cross-checked by two HCIS staff against interpreter booking and invoice records to confirm provision.
"Audit data was cross-checked by two HCIS staff members to confirm an interpreter was provided. This involved reviewing audit data with interpreter appointment bookings in the HCIS booking system and/or Translating and Interpreting Service invoices." (Morris, 2021, p. 427)
Who? #ⓘ
Adult inpatients with a preferred language other than English needing an interpreter, audited across eight hospitals in one regional NSW (Australia) local health district between July 2016 and March 2018; 90 episodes / 79 hospital stays / 74 patients, mostly aged 75 or over.
"The 74 individual patients included in the study had 79 unique hospital stays and 90 episodes of admitted patient care. The study consisted of mostly older patients, with 67.1% aged 75 years or over and slightly more females (n = 43, 54.4%)." (Morris, 2021, p. 427)
Other Notes #
The 54.4% figure is the proportion receiving an interpreter among those audited as needing one — a measure of unmet interpreter need (roughly half went without). The authors suggest, without establishing causality, that the district's sustained audit-feedback-action improvement program may have contributed to this relatively high rate.
Caveats #
- Exclusion of some wards and all obstetric patients limits generalisability (Morris 2021) The sample excluded some hospital wards and all obstetric patients (audited post-admission and therefore outside the inclusion criteria), as well as non-admitted (outpatient/ED ambulatory) patients. The authors note this limits the generalisability of the findings, so the utilisation rate and characteristics observed may not represent the full LEP inpatient population of the district.