LEP patients visited the ED less than EP patients within one year of bariatric surgery (adjusted OR 0.65)
Source
Allan E Stolarski (2022). The impact of English proficiency on outcomes after bariatric surgery. Surgical Endoscopy.
Description #
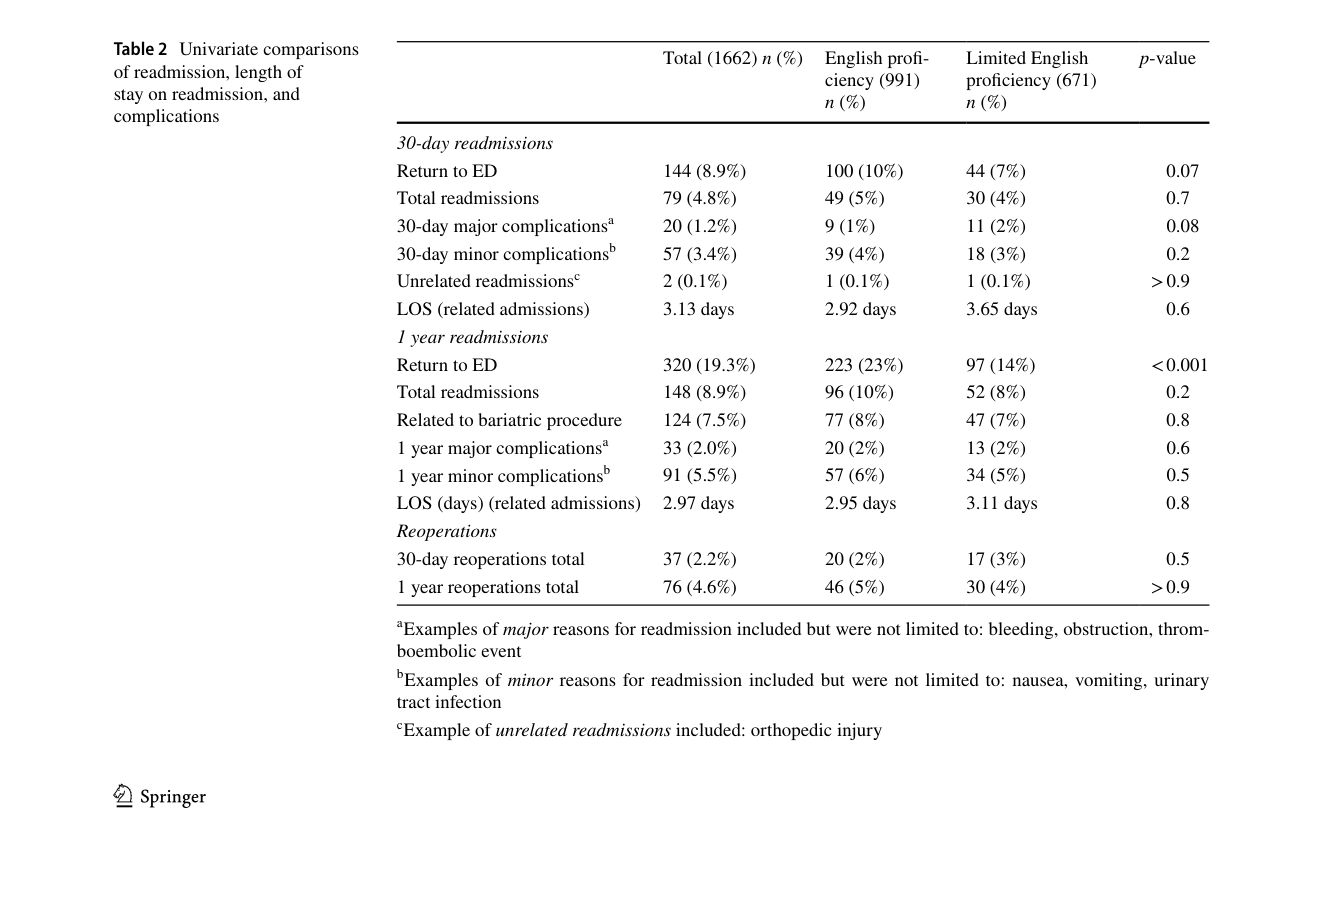
Contrary to the authors' hypothesis, within one year of the index bariatric procedure fewer LEP patients presented to the emergency department (ED) than EP patients (14% vs 23%; p < 0.001) (Table 2). After multivariable logistic regression for potential confounders this difference persisted, with an adjusted OR of 0.65 (95% CI 0.43–0.95; p = 0.029) — i.e., LEP patients had lower odds of an ED visit. By contrast, there was no significant difference in ED presentation within 30 days (EP 10% vs LEP 7%; p = 0.07).
"When we analyzed the data at one year from the index bariatric procedure, we found that fewer LEP patients present to the ED within one year as compared to EP patients; 14% vs. 23%; p < 0.001). After multivariable regression for potential confounders this significant difference in ED visits persisted; adjusted OR = 0.65 (95% CI 0.43–0.95; p = 0.029)." (Stolarski, 2022, p. 7387)
Methods Context #
What? #ⓘ
The observable: all-cause return visits to the emergency department within one year of the index operation, abstracted from the electronic medical record and compared between LEP and EP groups.
"Outcomes of interest included 30-day and one year all cause visits to the emergency department (ED), 30-day and one year readmission, length of stay (LOS) from index operation" (Stolarski, 2022, p. 7386)
How? #ⓘ
Retrospective chart review; ED-visit proportions compared with chi-square univariately, then adjusted with multivariable logistic regression using a priori confounders (age, sex, race, insurance status, ASA class, smoking status, year of operation, sleeve gastrectomy).
"Multivariable logistic regression was used to evaluate dichotomous outcomes including revisit to the ED, readmission, and 30-day complications." (Stolarski, 2022, p. 7386)
Who? #ⓘ
1662 patients aged 18+ undergoing laparoscopic sleeve gastrectomy or gastric bypass at one high-volume academic bariatric center (Boston Medical Center), Jan 2013–Dec 2017; 671 (40%) LEP, identified via interpreter use / documented non-English preferred language.
"671 patients were categorized as LEP (40%) (Table 1). Patients spoke six unique languages as their primary language." (Stolarski, 2022, p. 7386)
Other Notes #
The direction is opposite to the language-discordance literature the authors cite (which links LEP to higher ED use). The authors note the reason "remains unclear" and that the increased EP ED use "does not translate to increased admissions" (p. 7389). This finding therefore opposes a claim that discordance raises ED utilization in this well-resourced setting.
Caveats #
- Retrospective chart review could not capture care delivered at outside institutions or follow-up rates by group As a retrospective chart review confined to the institution's own EMR network, the study could not capture ED visits or readmissions that occurred at outside hospitals, and follow-up rates for the LEP and EP groups were not accounted for. Differential out-of-network utilization between groups could bias the observed ED and readmission comparisons (including the finding that LEP patients visited the ED less often).
- Single high-volume center with substantial interpreter infrastructure limits generalizability of equivalent bariatric outcomes The equivalent outcomes were observed at a single, high-volume academic center with substantial interpreter infrastructure (nearly 1.4 million interpreter requests over five years, in-person interpreters in 13+ languages, 24-hour voice/video access, multilingual surgeons, and educational/discharge materials printed in English, Spanish, and Portuguese). The authors caution that the findings may not transfer to institutions with fewer such resources, so the null/equivalence results cannot be read as evidence that LEP carries no risk in lower-resourced settings.